

Upvotes
0
Pricing
Freemium
Category
Productivity Tools
In the database since
Oct 2026
Overview
About Flourish
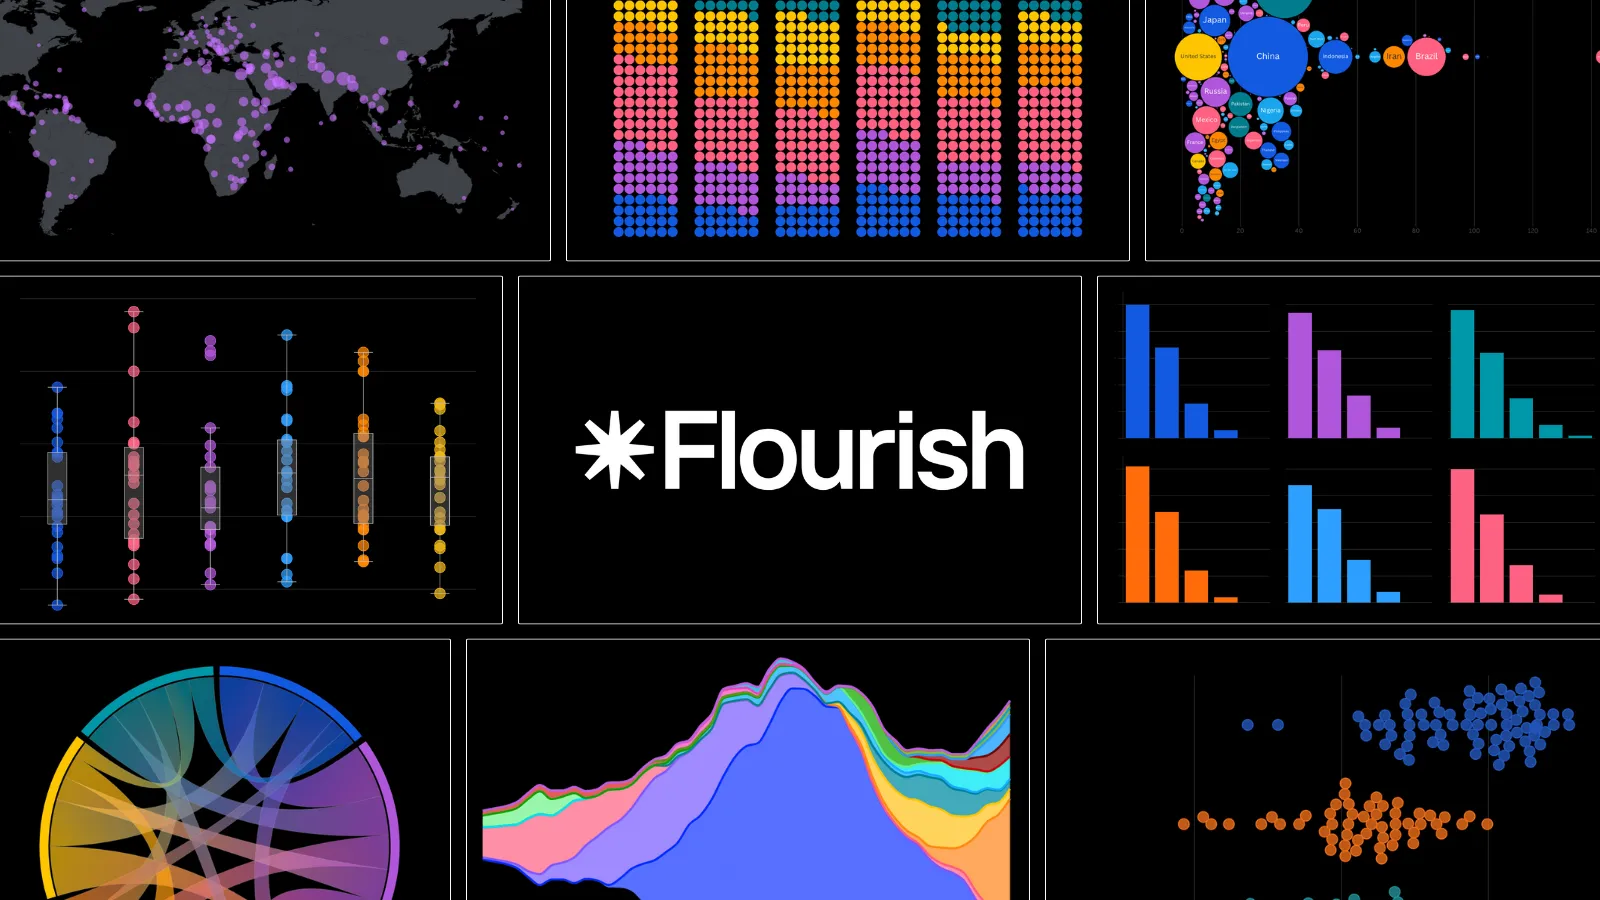
Flourish is a data visualization platform that turns spreadsheets into interactive charts and stories. You pick a template, add your data, and publish — no coding or design skills needed. It supports scrollytelling, interactive presentations, and audio-driven stories that guide readers through the numbers. Everything is mobile-friendly and easy to embed on any website. Developers can build custom templates with the Flourish SDK. Founded in 2018, Flourish was acquired by Canva in 2022 and is trusted by newsrooms like the BBC.
Key Features
1. No-Code Templates
Start from a template instead of a blank page. You upload a spreadsheet and get a polished chart without writing code or learning design.
2. Storytelling Formats
Build scrollytelling pages, interactive presentations, and audio-driven stories. These formats walk your audience through the data step by step.
3. Embed Anywhere
Publish charts that work on any screen size, from phones to desktops. You can embed them on websites or share them with a link.
4. Custom Templates With the SDK
Developers can use the Flourish SDK to build fully custom templates. There are no limits on what the templates can do or how they look.
5. Live Data Connections
Connect a live data source or use the API to keep charts fresh. Dashboards and published projects can update without rebuilding everything.
6. Built for Sharing Stories
Flourish focuses on data storytelling for presentations and publications, not complex business dashboards. Outputs are styled to reach wide audiences.
Frequently Asked Questions (FAQ)
What is Flourish used for?
Flourish turns data into interactive charts, maps, and stories for the web. Newsrooms, companies, and creators use it to explain numbers visually.
Do I need to know how to code?
No. Flourish is template-based, so you upload a spreadsheet and customize the result. The company says no specific technical skills are needed.
Is Flourish a business intelligence tool?
Not typically. Flourish says its focus is data storytelling for presentations and digital publications, rather than business intelligence dashboards.
Who is behind Flourish?
Flourish was co-founded in 2018 by Duncan Clark and Robin Houston. In 2022, Canva acquired Flourish to make data visualization accessible to all.
Where can I publish my visualizations?
You can embed Flourish charts on any website, share them with a link, or present them as interactive slideshows. Outputs are optimized for mobile viewing.
Conclusion
Flourish makes data feel human. Its templates remove the technical barrier, so anyone can build charts that people actually enjoy exploring. It shines for stories, reports, and presentations rather than deep number-crunching. Newsrooms around the world trust it daily. If you want your data to reach a wide audience, it is a solid choice for stories and reports.
Keep exploring
Similar AI tools
Ranked by the job they do, their capabilities, and how closely they fit this workflow.