
Grafana
Live dashboards, alerts, and monitoring for metrics, logs, and traces.
Upvotes
0
Pricing
Freemium
Category
Automation Tools
In the database since
Oct 2026
Overview
About Grafana
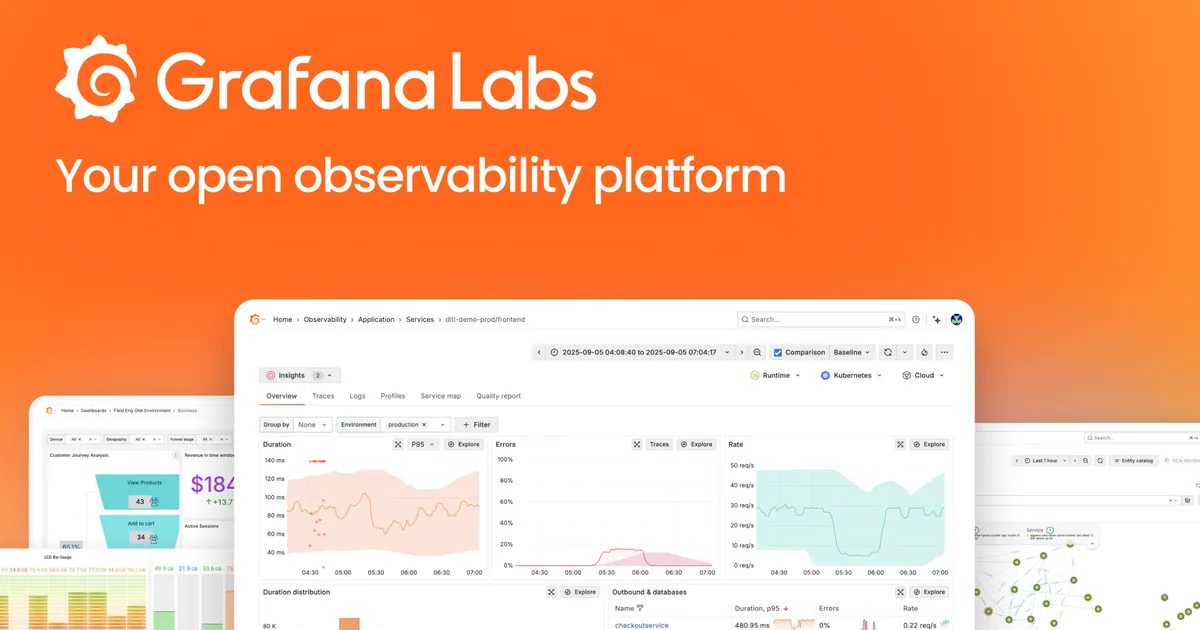
Grafana is an observability platform that turns raw machine data into live, readable dashboards. It pulls together three kinds of signals: metrics, which are numbers measured over time; logs, which are text records of events; and traces, which show a request's path through services. Teams use it to watch servers, apps, and networks in one place. You can run it on your own server or use the hosted Grafana Cloud. Built-in alerting pings you when something breaks, and it connects to popular databases and monitoring tools.
Key Features
1. Live dashboards
Build panels with charts, gauges, and tables that refresh in seconds. Dashboards can be shared with a link or shown on wall displays.
2. Automated alerting
Set rules on any metric, log, or trace. Grafana sends alerts to email, Slack, PagerDuty, or webhooks when a threshold is crossed.
3. Familiar query languages
Query metrics with PromQL, logs with LogQL, and traces with TraceQL. Each language matches its data type, so queries stay readable and fast.
4. Hosted free tier
Grafana Cloud's free plan covers 10,000 active metric series, 50 GB of logs and traces each month, and three active users.
5. Load testing with k6
Grafana k6 simulates virtual users hitting your site to find breaking points. The free tier includes 500 virtual user hours per month.
6. Incident response
Grafana IRM adds on-call schedules, escalation paths, and postmortems. The free tier covers three active incident responders.
7. Self-hosted option
The core is open source and runs on your own hardware. There are no user caps when you host it yourself.
Frequently Asked Questions (FAQ)
How much does Grafana Cloud cost beyond the free tier?
Pro starts at $19 per month plus usage-based charges. Metrics are billed per active series, while logs, traces, and profiles are billed per gigabyte. Enterprise starts with a $25,000 annual commitment.
How is Grafana different from Datadog?
Grafana is open-core, so you can self-host it for free, while Datadog is SaaS-only. Grafana bills by data usage, whereas Datadog bills per host plus per product. Teams often pick Grafana to keep observability costs tied to actual data volume.
Which data sources can Grafana read from?
Grafana connects to more than 100 sources, including Prometheus, MySQL, PostgreSQL, Elasticsearch, and cloud providers. Official and community plugins extend this list further. You can mix several sources on one dashboard.
What does AGPL mean for Grafana users?
AGPL is the license on Grafana's open-source core. Running Grafana internally is completely fine. You only need to share your changes if you modify Grafana itself and distribute it to others.
Conclusion
Grafana gives teams one window into everything their systems are doing. Its dashboards turn messy telemetry into charts anyone can read, while alerts and on-call tools catch trouble early. The free cloud tier handles small setups well, and self-hosting keeps costs flat at scale. If you want observability without per-host billing, Grafana is a solid starting point.
Keep exploring
Similar AI tools
Ranked by the job they do, their capabilities, and how closely they fit this workflow.